



Analyzing a large-scale retail chain's network solely through group performance (total revenue, total number of stores) often risks providing a partial picture. To truly understand a retailer's role in the consumer system, it is necessary also observe the socio-demographic structure of the territories in which it operates, because it is precisely there that the contours of the question are defined, the purchasing behaviors and opportunities for the food industry.
In this article we will carry out an analytical analysis of 568 points of sale of the IN'S network (this is the latest data in the Top Sales database), focused exclusively on demographic variables of the reference catchment areas, offering a very clear reading: the sign presents an extremely balanced distribution across all the main socio-territorial variables, confirming its positioning as a format capable of adapting to profoundly different contexts.
I reference basins of the group under analysis were indicated by all those consumers who are within 5 minutes (for sales points over 400 m2) or 2 minutes (under 400 m2) by car from each individual sales point in the group.
This analysis was performed with the Application Top Sales inside the portal GDO data.
Analyzing the area and clusters of the IN'S Mercato network means first of all trying to understand the size of the so-called isochrones of consumers that gravitate around the stores. The first element to observe is in fact the pure size of the catchment area of each store, that is whether each outlet is located in a context with many consumers or in an area with a more limited demand baseThis is a fundamental fact: a store with many customers has, in itself, more potential.
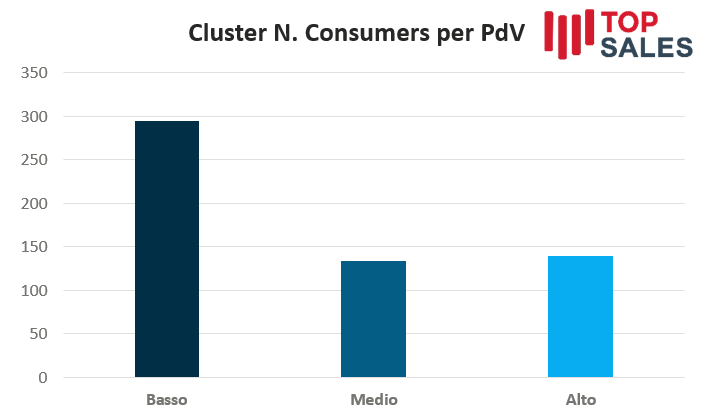
In the case of IN'S, this data does not represent a particularly distinctive element, in the sense that the majority of the stores, almost 300, are located in a cluster with a rather low number of consumers per storeAlthough the medium and high clusters are not marginal, the network appears to be characterized by a prevalence of stores located in catchment areas with fewer than 15.000 consumers, a value that falls within the definition of a low cluster, even though the size of its stores is suitable for this type of consumer number.
In parallel to this article, we published individual store turnover data and profitability per square meter on GDO News today. The published numbers are consistent with the store sizes and catchment areas indicated here.
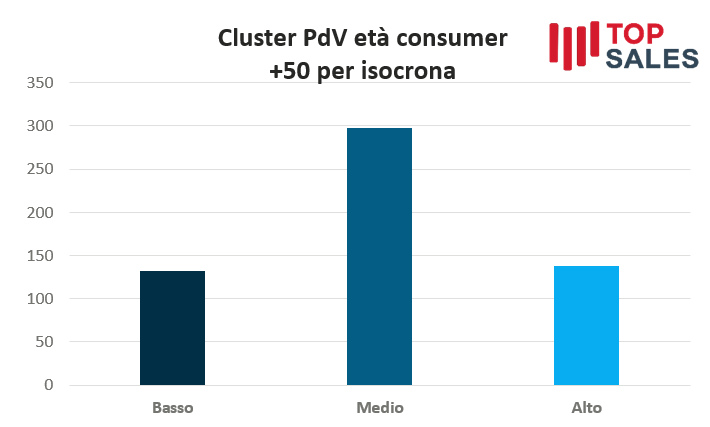
The second step of the analysis concerns the demographic composition of consumersWe have set the App to detect the cluster of sales outlets with a greater presence of consumers over 50 years of age and under 70 years old, a group that is identified as that of the so-called big spenders. Reading the data highlights that most of the outlets are located in a medium cluster, with a balanced presence of consumers belonging to this segment. However, there are limited cases in which the presence of over 50s is particularly high., just as there are few stores where this component is very small.
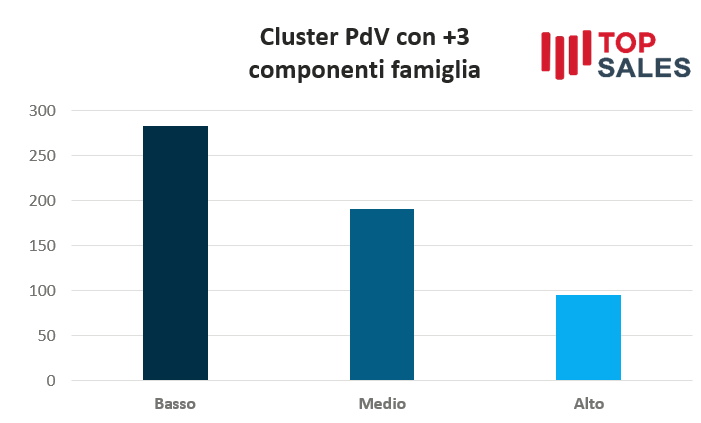
Continuing the analysis, we observed the composition of families in the reference catchment areas, asking the App to distinguish the sales points based on the presence of families with more than three membersThe results show how they are there are many stores where the family composition is less than three people per household, a number between 250 and 300 stores. Cases with a very high incidence of large families are few, while the average cluster, with approximately three members per family, is appreciable but less than 200 units.
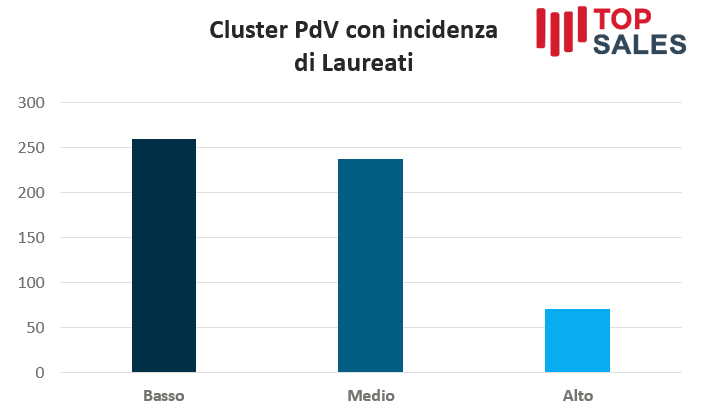
A further element analysed concerns the incidence of graduates. In this case a prevalence of sales outlets whose catchment areas have a low level of education, even if a significant portion has an average incidence of graduates, data which takes on a positive value. Considering the medium and high clusters together, these numerically exceed the group with low incidence of graduates per point of sale.
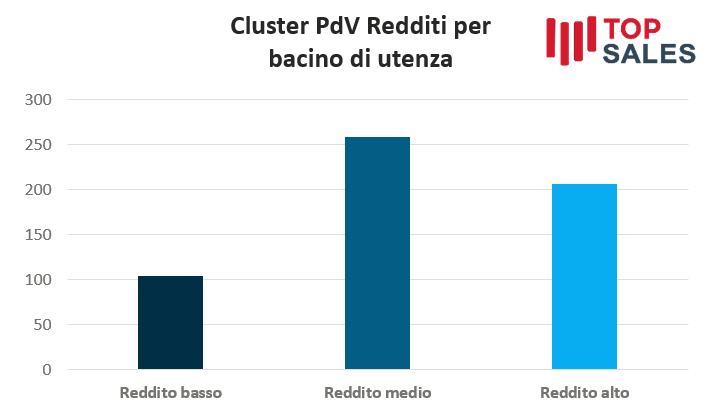
Income analysis in catchment areas offers a particularly interesting read. Between medium and high incomes, the number of points of sale is very high, exceeding 450 unitsThis is a significant figure, because it highlights how, out of a total of 568 stores analyzed, well over 450 are located in isochrones with catchment areas characterized by above-average income levels.
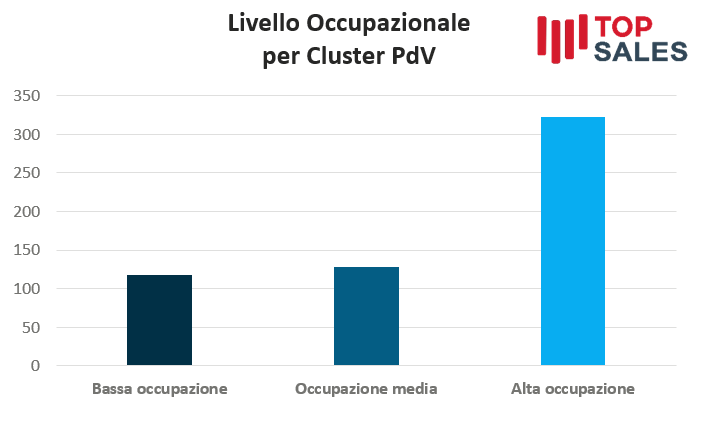
A similar picture emerges when observing the level of employmentAdding together the clusters with medium and high occupancy, we find a very large presence of sales points, while the clusters characterized by low occupancy amount to just over 100 units.
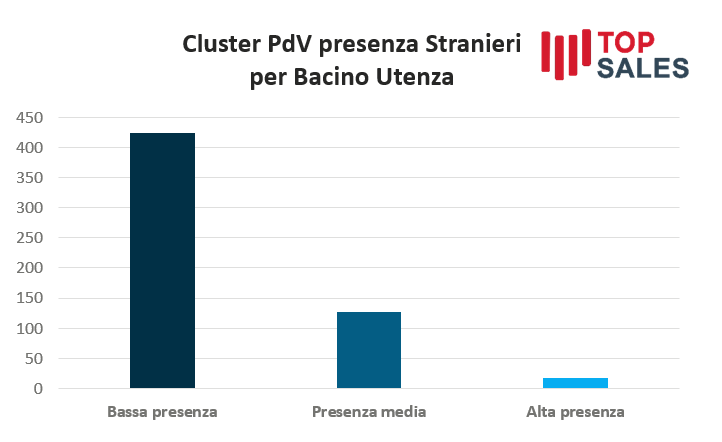
The last element taken into consideration is the presence of foreign populationIn this case the reading is quite clear: the presence of foreigners is very low in most of the IN'S network and, considering the medium and high-presence clusters together, the number does not reach 150. This means that the catchment areas of the stores are overwhelmingly Italian.